What Whitman sees and scrolls: surveying social media and entertainment
June 28, 2023
Social media and digital entertainment have been a major part of teen life for years now, but recognition of the dangers both of too much screen time and of too much scrolling is more common than ever. The Black & White surveyed a sampling of students across all four grades to compile information on how they see their own habits and preferences in social media and entertainment usage.
Social media:
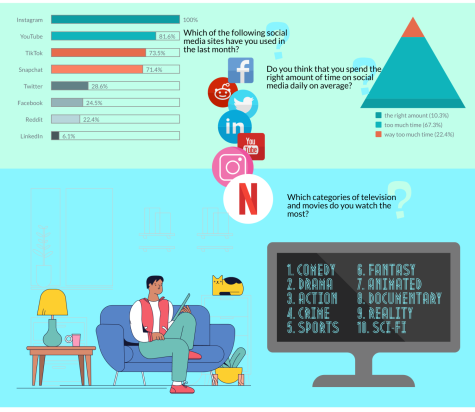
Of students surveyed, 100% of respondents said that they had used Instagram in the last month. 81.6%, 73.5% and 71.4% of students surveyed said they had used YouTube, TikTok and Snapchat respectively in the last month, making those four social media platforms the most popular among Whitman students right now.
The least popular social media sites over the last month were Twitter, Facebook, Reddit and LinkedIn at 28.6%, 24.5%, 22.4% and 6.1%, respectively.
When asked which of their social media apps they spend the most hours using, 44.9% of respondents cited Instagram, with TikTok coming in second at 30.6%.
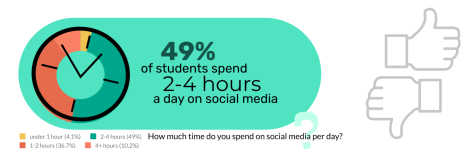
On average, the most common range of time students reported spending daily on social media was two to four hours at 49%, while 10.2% said they spend over four hours, 36.7% between one to two and only 4.1% under one.
When asked their opinions on their average amount of time, 67.3% of respondents said that they believe that they spend “too much time” on social media per day and 22.4% said that they spend “way too much time.” Only 10.3% said they believe they spend “the right amount of time.” By contrast, Pew Research reported in 2022 that 55% of teens said they believed they spent “the right amount” — making Whitman an outlier in students’ self-concern and suggesting Whitman students may be more conscious of their screen time than teens are on average. No Whitman students assessed that they spend “too little time” on social media every day, while for the country, 8% did.
Entertainment:
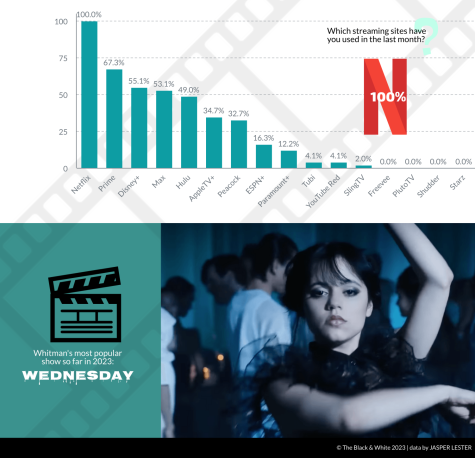
Of the Whitman students surveyed, 100% said that they had watched Netflix in the past month. Other popular streaming platforms were Amazon Prime Video at 67.3%, Disney+ at 55.1% and Max at 53.1%. When asked which streaming service they used the most, 75.5% of respondents said Netflix, with HBO Max a distant second at 12.2%.
Selecting which categories of television or movies they watched the most, 73.5% of respondents chose “comedy,” 69.4% “drama” and 51% “action/adventure.” The least popular categories of “romance” and “talk/late-night shows” both stood at 4.1%.
On average, 57.1% of respondents said they spent under an hour per day watching television or movies, 30.6% between one and two hours and 12.2% between two and four. No respondents answered that they spent more than four hours watching television or movies per day. 
Asked their opinions on the amount of time they spend watching television or movies per day, Whitman students gave significantly different responses than when asked the same about social media usage, with 69.4% saying they spend “the right amount of time” with on-screen entertainment. Only 24.4% said they spend “too much time” or “way too much time” with television or movies, and 6.1% “too little.”
The shows Whitman students reported watching the most included “Wednesday,” “Breaking Bad,” “Shameless” and “New Girl.” Of the four, “Wednesday” is the only show still in production, suggesting a high preference of re-watching and catching up on old seasons of classic shows.


